Material flow in the assembly of products on a production line
1. Introduction
Simulation modeling is an analytical method that involves a virtual, computer-based version of a system or process. The model allows for accurate representation of the key elements and mechanisms of the actual operation of the analyzed phenomenon in a simplified manner, while retaining its essential features. Through simulation, i.e., a series of computer experiments, it is possible to observe how the model reacts to various variables and changes in conditions or events.
The main purpose of creating simulation models is both to understand the functioning of the system under study and to predict its future behavior and assess the effects of decisions made. It allows you to test different scenarios of a concept or solution to a problem without incurring the risks and costs that would be associated with implementing them in reality.
Modeling is most useful in situations where systems are complex, dynamic, and difficult to analyze using traditional methods.
2. Assumptions of the analyzed example.
The model presents an assembly station that allows for the creation of a set of components as well as their assembly. The structure of the model is characterized by an example of a set of three components taken from separate warehouses. In the analyzed example, the employee shift lasts 8 hours, and the assembly time for one assembly unit is 45 minutes. To create the final part, two components from warehouse 1, one component from warehouse 2, and 6 components from warehouse 3 are required.
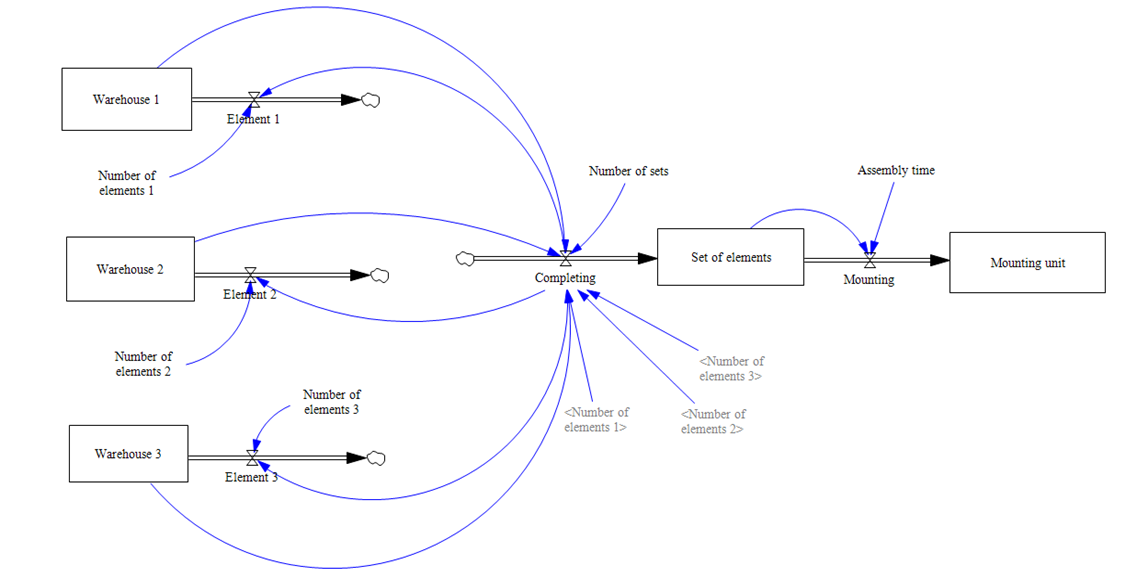
Fig. 1 Simulation model. Source: Own work
In the simplified model of the process, there is no control over the availability of components, and it is assumed that a specific number of sets are created per unit of time. The most important factor in the model is Completing, because it checks the availability of components and retrieves the appropriate number of parts from warehouses. The time required to retrieve components and transport them is also added to the assembly time. To calculate the flow value, Completing shows the number of sets created according to the following formula:
Completing = IF THEN ELSE(Warehouse 1>=Number of sets*Number of elements 1:AND:Warehouse 2>=Number of sets*Number of elements 2:AND:Warehouse 3>=Number of sets*Number of elements 3, Number of sets , 0 )
Creating sets reduces the availability of elements in warehouses, which is described by the following relationship:
Element 1 = Completing*Number of elements 1
Element 2 = Completing*Number of elements 2
Element 3 = Completing*Number of elements 3
Assembly, i.e. the last flow, enables the collection of sets of elements and transforms them into assembly units according to the following formula:
IF THEN ELSE(Set of elements>=1/Assembly time, 1/Assembly time , 0 )
This shows that for the value of Set of elements>=1/Assembly time, assembly is performed with an efficiency of 1/Assembly time, otherwise the assembly process is not performed.
3. Simulation and interpretation of graphs

Fig. 2 Simulation results. Source: Own work.
The graphs illustrate changes in the quantity of materials in three warehouses and the corresponding consumption of components over time, expressed in minutes. At the beginning, the warehouses contain approximately 200, 100, and 600 units of material, respectively. We can see that the stock levels in each of them decrease linearly, which indicates that the material is being consumed evenly over time. All three warehouses are completely emptied after approximately 100 minutes, which means that their consumption rate is relatively high. The components associated with these warehouses exhibit similar behavior, as their values also drop to zero.
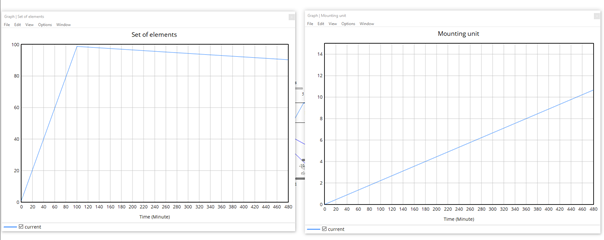
Fig. 3 Simulation results. Source: Own work.
The graphs show the number of sets of elements and assembly units over time. The “Set of elements” graph shows that up to approximately 100 minutes, there is a linear increase in the number of sets of elements, up to a level of 100 units, which indicates an intensive and uniform production process. After reaching the maximum value, we observe a slow, gradual decrease in the number of sets, which may mean that the production process has been completed or limited due to the use of all resources from the warehouses.
In turn, the “Mounting unit” graph shows a steady linear increase in the number of assembly units throughout the entire observation period, i.e., 8 hours, which indicates continuous and stable operation of the assembly process. This pattern suggests that the assembly units are produced based on pre-prepared sets of components.
4. Conclusions
When analyzing the graphs, it is noticeable that all warehouses consume materials evenly and are completely emptied after approximately 100 minutes, which indicates a high, constant intensity of the process. The consumption of components is also linear. The number of component sets first increases to 100 and then gradually decreases after the stock has been used up. Assembly units, on the other hand, increase linearly throughout the observation period, suggesting smooth, continuous production. The simulation shows the stability and uniformity of most of the processes analyzed.
No Comments