Inventory Level Management with Random Demand
1. WprowadzenieIntroduction
Inventory management under conditions of uncertainty and delivery delays presents a significant challenge in logistics and initial planning. To analyze the maintenance of the warehouse system, a simulation model based on a system controller was used. The model was developed in the Vensim environment, which enables graphical representation as well as practical numerical analysis. The goal of the model was to replicate the inventory replenishment process under conditions of random demand, incorporating delivery delays and attempting to maintain inventory at a specified target level.
Zarządzanie zapasami w warunkach alternatywnych i opóźnień w dostawach stanowi istotne wyzwanie w logistyce i planowaniu początkowym. W celu analizy utrzymania systemu magazynowego wykorzystano model symulacyjny oparty na kontrolerze systemów. Model opracowano w środowisku Vensim, który umożliwia graficzną reprezentację pochodną oraz istniejącą użytkowo numeryczne. Celem modelu było odwzorowanie procesu uzupełniania zapasów w warunkach losowego ostatecznego, przy zastosowaniu rozwiązania w dostawach oraz próby utrzymania zapasu na określonym poziomie kryteriów.
2. StrukturaModel modeluStructure
ModelThe przedstawiamodel uproszczonyrepresents systema zarządzaniasimplified zapasami,inventory wmanagement którymsystem, uwzględnionowhich następująceincludes elementy:the following elements:
-
MagazynWarehouse-–reprezentujeRepresentsaktualnythepoziomcurrentzapasówinventorydostępnychlevelwavailablesystemie.inJestthe system. It is a state variable that changes due tozmiennadeliveriesstanu,andktóraproductzmieniareleases.się w wyniku dostaw i wydań towaru, -
DostawaDelivery –strumieńThetowarówinflowwpływającyofdogoodsmagazynu,intouzupełniającythezapasy.warehouse,Jestreplenishing the inventory. It is a flow variable controlled by the difference between the expected inventory level and the current inventory level in the warehouse. -
Product Release – The outflow of goods from the warehouse in response to
zmiennademand.przepływu,Itktóra jest kontrolowana przez różnicę między oczekiwanym poziomem zapasówis abieżącymflowpoziomemvariablewlimitedmagazynie,by the available stock in the warehouse and the current demand. -
WydanieDemandtowaru–strumieńAtowarówrandomopuszczającyinputmagazynvariablewthatodpowiedzideterminesnathepopyt.demandJestfor goods in a given period. It models market uncertainty. -
Expected Inventory Level – A constant target level the system strives to
zmiennamaintain.przepływu, która jest ograniczona dostępnymi zapasami w magazynie oraz bieżącym popytem, -
PopytDelivery Interval –losowaThezmiennatimewejściowa,intervalktóraatokreślawhichzapotrzebowaniedeliveriesnatotowarthewwarehousedanymareokresie.made.Modeluje niepewność rynkową, -
OczekiwanyMarketpoziom zapasów–stałyAccumulatespoziomthedocelowy,amountdoofktóregogoodssystemreleaseddąży,from Okresthedostawywarehouse–thatczas,havecosatisfiedjakitherealizowanedemand.są dostawy do magazynu,
·The Rynekmodel –is akumulujebased ilośćon towaru,the którafollowing zostałamathematical wydana z magazynu i zaspokoiła popyt,relationships:
Model opiera się na następujących zależnościach matematycznych:
Magazyn:Warehouse:
Dostawa-Wydanie towaru
Rynek:
MIN ( Wydanie towaru , Popyt )
Dostawa:
IF THEN ELSE ( MODULO ( Time,Okres dostawy) = 0 , Oczekiwany poziom zapasówDelivery - MagazynProduct , 0 )
Popyt:
RANDOM UNIFORM(500, 1000, 50)
Okres dostawy: 1
Oczekiwany poziom zapasów: 1000
Wydanie towaru:
IF THEN ELSE ( Magazyn>0,MIN ( Magazyn/2, Popyt/2 ) ,0)Release
Market:
MIN(Product Release, Demand)
Delivery:
IF THEN ELSE (MODULO( Time, Delivery Interval) = 0, Expected Inventory Level - Warehouse, 0)
Demand:
RANDOM UNIFORM(500, 1000 50)
Delivery Interval: 1
Expected Inventory Level: 1000
Product Release:
IF THEN ELSE( Warehouse > 0, MIN(Warehouse/2, Demand/2), 0)

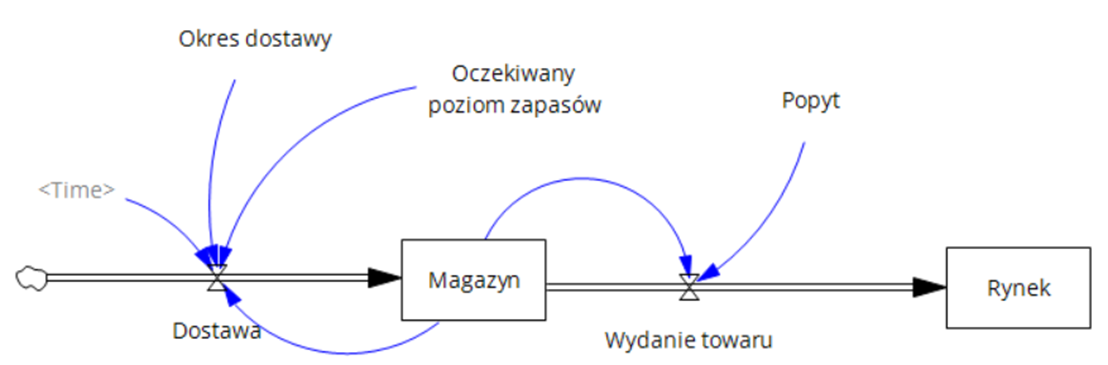
Rysunek.1Figure 1. Inventory Management Process Model procesuwith zarządzaniaRandom poziomemDemand
3. zSimulation losowymResults popytemAnalysis
Warehouse (Inventory Level)
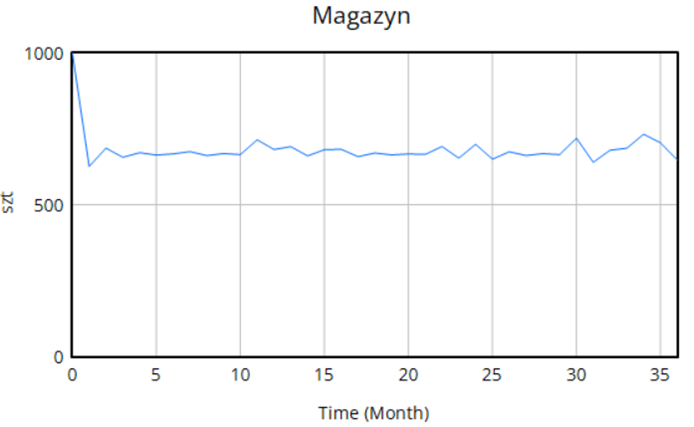
3.The Analizagraph wynikówshows symulacjithe inventory level in the warehouse over time (in real-time). The available stock starts at approximately 1000 units, after which the inventory stabilizes, fluctuating around 650–750 units. These fluctuations are caused by the randomness of demand and the cyclical nature of deliveries. The chart illustrates how the inventory system maintains a balance, avoiding stockouts due to built-in system constraints that prevent inventory depletion caused by coincidental demand surges.
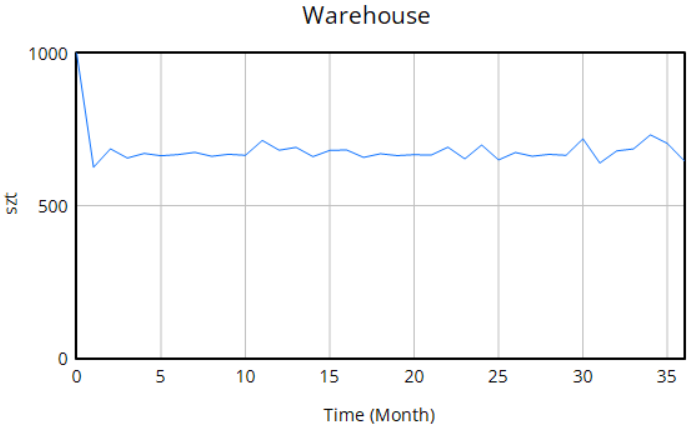
Magazyn (stan zapasów)
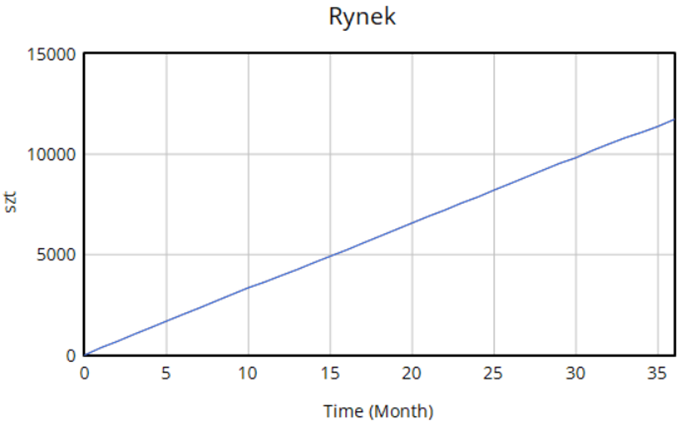
WykresMarket
The poziomgraphs zapasówshow wthe magazyniecumulative wamount czasieof (wgoods miesiącach).that Początkowohave widocznybeen jestreleased spadekfrom zthe poziomuwarehouse okołoand 1000have sztuk,satisfied ademand następniethroughout stanthe zapasówsimulated stabilizujeperiod. się,The oscylującline wokółon wartościthe okołograph 650-750is sztuk.linear Wahaniaand wincreasing, poziomieindicating magazynuthat wynikajądemand zis losowegobeing popytumet orazand cyklicznychthat dostaw.goods Pomimoare zmiennegoconsistently popytu,reaching systemthe efektywniemarket, utrzymujealbeit zapasywith nasome względniedelay. stabilnymThere poziomie,are unikającno wyczerpaniavisible magazynu,drops coor świadczysurges oin pewnejthe odpornościdelivery systemufrequency, nawhich zmienność.confirms the efficiency and stability of the system's supply process.
Rynek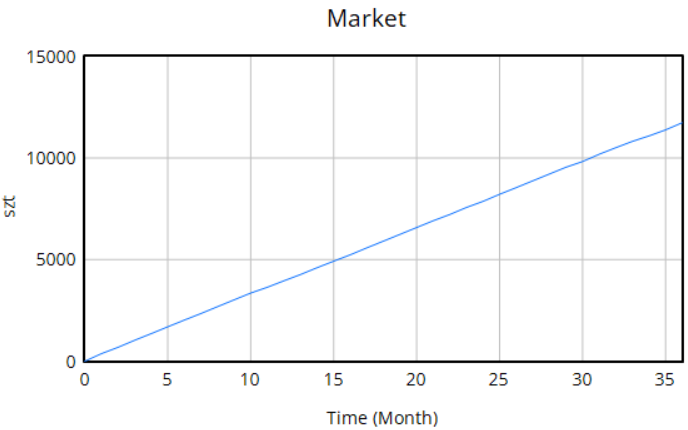
Wykres prezentuje skumulowaną ilość towaru, która została wydana z magazynu i zaspokoiła popyt w ciągu symulowanego okresu. Linia na wykresie ma charakter liniowy i rosnący, co oznacza, że popyt jest konsekwentnie zaspokajany, a towar trafia na rynek w stałym tempie. Brak gwałtownych spadków czy wzrostów świadczy o płynności procesu wydawania towaru, co jest pozytywnym sygnałem dla efektywności systemu.Delivery
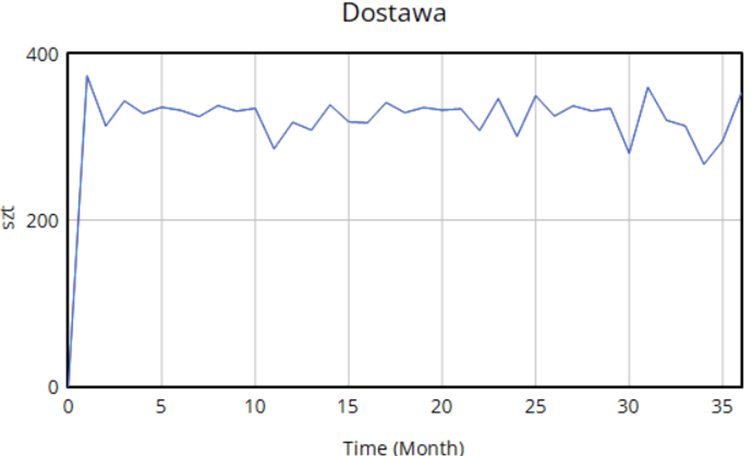
Dostawa
Wykresdepending dostawon pokazujethe zmiennącurrent ilośćinventory towaru,level któraand jestthe regularniesystem's dostarczanatarget dostock magazynu.level. Widać,The żeinitial, dostawylarger sądelivery realizowaneis cointended miesiąc,to aquickly ichreplenish wielkośćthe wahawarehouse sięafter wan zależnościearly oddrop aktualnegoin poziomuinventory, zapasówafter wwhich magazyniethe ideliveries celu,adjust jakimaccording jestto osiągnięcieactual oczekiwanego poziomu. Początkowa, wyższa dostawa ma na celu szybkie uzupełnienie magazynu po początkowym spadku zapasów, a następnie wielkość dostaw dostosowuje się do bieżących potrzeb.needs.
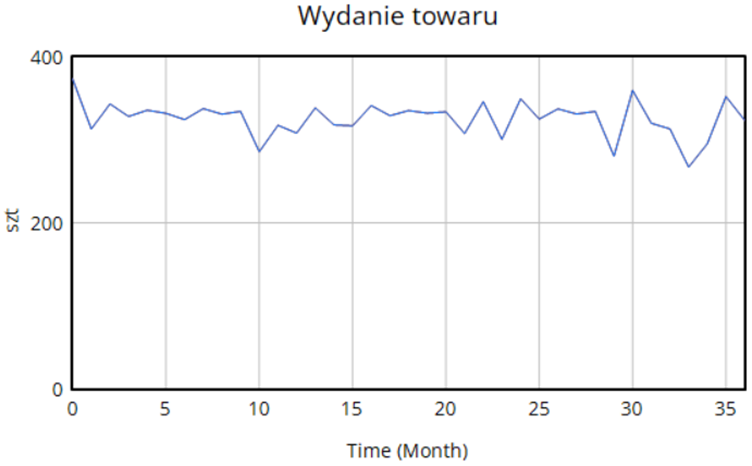
Wydanie towaru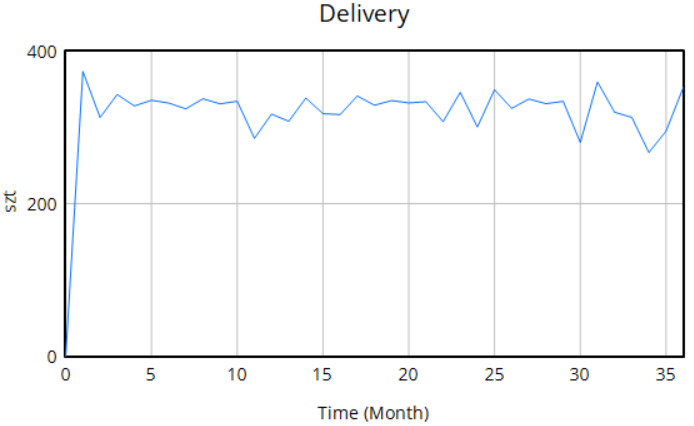
WykresProduct Release
The "WydanieProduct towaru"Release" przedstawiagraph ilośćshows towaruthe opuszczającegoquantity magazyn.of Wykresgoods tenleaving jestthe ściślewarehouse. powiązanyThis zgraph popytemclosely icorresponds poziomemto magazynu.both Widocznedemand sąand wahania,available któreinventory. odzwierciedlająFluctuations zmiennośćare popytu,visible, alereflecting generalnierandom utrzymujevariations sięin nademand, poziomiebut okołothey 300-generally stabilize around 300–350 sztuk.units. PorównującWhen zcompared wykresemwith the "Popyt",Demand" możnagraph, zauważyć,it żecan be observed that the system wlargely dużejmeets mierzedemand, jestwhich wis staniecrucial zaspokajaćfor popyt,effective coinventory jest kluczowe dla efektywnego zarządzania zapasami.management.
Popyt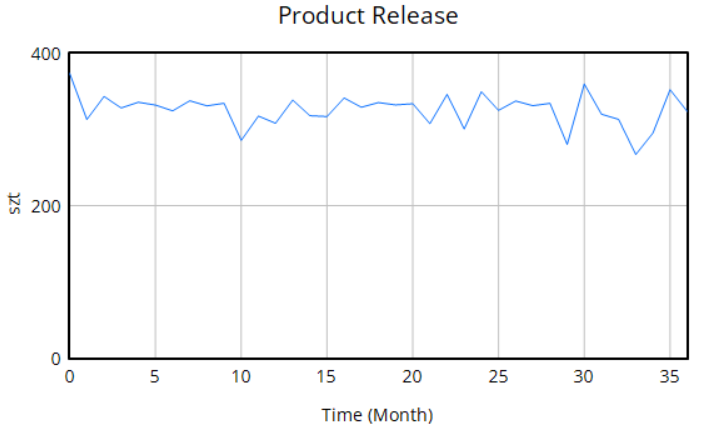
WykresDemand
The "Popyt"Demand" ilustrujegraph losowyillustrates charakterthe zapotrzebowaniarandom nanature towar.of Widoczneproduct sądemand. wyraźneNoticeable fluktuacjefluctuations woccur czasie,over ztime, wartościamiwith zmieniającymivalues sięranging wapproximately zakresie od okołofrom 500 doto 1000 sztuk,units, zgodniein zaccordance funkcjąwith zastosowanąthe wfunction modelu.applied Tain zmiennośćthe popytumodel. jestThis głównymvariability czynnikiemhighlights wpływającymthe nadynamics dynamikęof systemuthe magazynowegowarehouse isystem wyzwanie,and któremuthe challenges that the model musiis sprostać.designed to address.

Oczekiwany poziom zapasów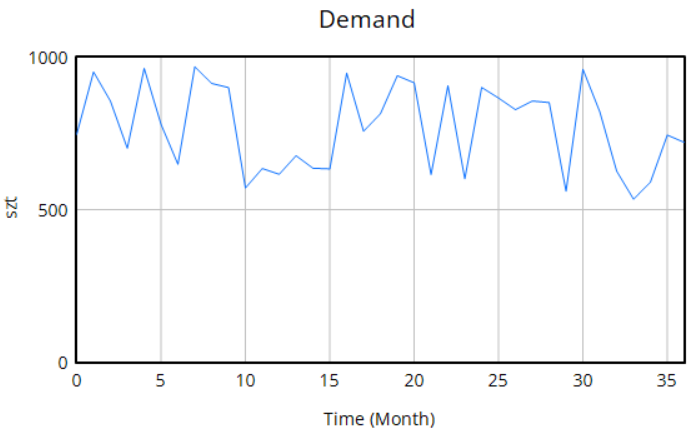
PoziomExpected oczekiwanyInventory utrzymujeLevel
The jakoexpected stałlevel is set as a wartośćconstant value (1000 jednostek)units), będącwhich punktemserves odniesieniaas dlathe sterowaniasystem’s procesemreference uzupełnień.point Brakfor zmianinventory wartościcontrol. sugerujeThe braklack adaptacjiof strategiichange zarządzaniain zapasemthis wbase czasievalue symulacjilimits –the adaptability of the inventory management strategy in real time—the model operujeoperates nawith stałyma progufixed decyzyjnym.decision threshold.
4. WnioskiConclusions
PrzeprowadzonaThe symulacjaconducted modeluinventory zarządzaniamanagement poziomemmodule magazynuwith zrandom losowymdemand popytemin w środowiskuthe Vensim dostarczyłaenvironment cennychprovides spostrzeżeńvaluable dotyczącychinsights dynamiki systemu, skutecznie odwzorowując proces uzupełniania zapasów w zmiennych warunkach rynkowych. Pomimo losowego popytu,into system jestbehavior, weffectively staniereplicating utrzymaćthe względniestock stabilnyreplenishment poziomprocess zapasówunder wcontrolled magazynie,conditions. oscylującDespite wokółrandom średniejfluctuations, wartości, co oznacza, że zastosowana polityka dostaw, bazująca na oczekiwanym poziomie zapasów i cyklicznym uzupełnianiu, efektywnie przeciwdziała dużym wahaniom i minimalizuje ryzyko niedoborów. Wykres "Rynek" jednoznacznie pokazuje, żethe system skutecznieis zaspokajacapable popyt,of comaintaining jestinventory kluczowelevels dlain ciągłościthe działaniawarehouse, ioscillating satysfakcji klienta; brak znaczących luk między popytemaround a wydaniemtarget towarurange. wskazujeThis nasuggests dobrzethat zoptymalizowanythe proces.implemented Popytdelivery jakopolicy, zmiennabased losowaon jestreaching głównymthe źródłemdesired dynamikistock ilevel wahańand wreplenished całymcyclically, systemie,responds well to fluctuations and minimizes the risk of shortages.
The "Market" graph confirms that the system meets demand, which is crucial for operational continuity and customer satisfaction; no noticeable gaps are observed between product release and demand, indicating well-controlled performance. Demand, as a widocznerandom sąvariable, reakcjeintroduces dostawvariability ithroughout wydańthe towarusystem, nabut zmianyit popytu,is coconsistently potwierdzamet, wrażliwośćdemonstrating modeluthe namodel’s zewnętrzneresilience zakłócenia.to Podsumowując,external opracowanydisruptions.
This model stanowiserves solidną podstawę do dalszych badań procesów zarządzania zapasami, szczególnie w kontekście zmieniających się warunków rynkowych i potrzeby utrzymania równowagi między kosztamias a poziomemsolid obsługi.foundation for further research in inventory management, especially in the context of changing market conditions and the trade-off between cost efficiency and service level.