Analysis of Project Fund Spending
1. Introduction
The goal of the model is to analyze how financial resources are spent during project execution. The model was developed using Vensim PLE software and the System Dynamics methodology, which allows mapping relationships between resources, costs, project progress, and the budget over time. The analysis covers a 24-month period, with a time step of one month.
2. Model description
The model presents the dynamics of financial resource spending throughout the project duration. It takes into account elements such as human resources, work efficiency, unit costs, unforeseen expenses, and potential savings. The key variables are: project progress and funds spent, both integrated over time based on execution and spending rates.The model allows for analyzing how changes in resource structure and costs affect the budget and project execution, thus enabling better planning and decision-making.
Stocks (Levels):
- Available budget – the total pool of financial resources remaining to be used.
- Funds spent – the total amount of money spent so far.
- Project progress – the level of project advancement.
Flows:
- Spending rate – the rate at which financial resources are spent.
- Execution rate – the rate of project completion (percentage of progress per time unit).
Variables:
- Human resources – the number of people involved in the project.
- Efficiency – one person’s productivity, defined as % progress per time unit.
- Unit cost – cost of completing one unit of progress.
- Unforeseen costs – additional costs arising during the project.
- Savings – potential cost reductions in later project phases.
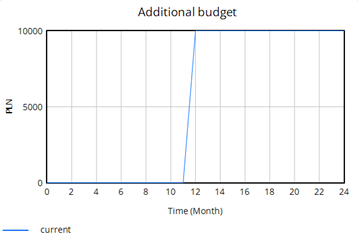
- Additional budget – extra funds that may be granted.
Equations used in the model:
Execution Rate = Human Resources * Efficiency
Project Progress = INTEG(Execution Rate, 0)
Spending Rate = Execution Rate * Unit Cost + Unforeseen Costs - Savings
Funds Spent = INTEG(Spending Rate, 0)
Available Budget = INTEG(Additional Budget – Spending Rate, 100000)
Unforeseen Costs = IF THEN ELSE(Time > 12, 4000, 0)
Savings = IF THEN ELSE(Time > 15, 2000, 0)
Additional Budget = IF THEN ELSE(Available Budget < 10000, 10000, 0)
Simulation objectives:
Observe changes in available budget over time.
Monitor project progress.
Analyze the impact of additional costs and savings.
Assess how changes in workforce and efficiency affect costs and progress.
The model enables:
Tracking budget usage and identifying potential deficits.
Monitoring project progress and comparing it with the schedule.
Analyzing the impact of cost fluctuations.
Testing scenarios related to workforce and resource management for optimization.
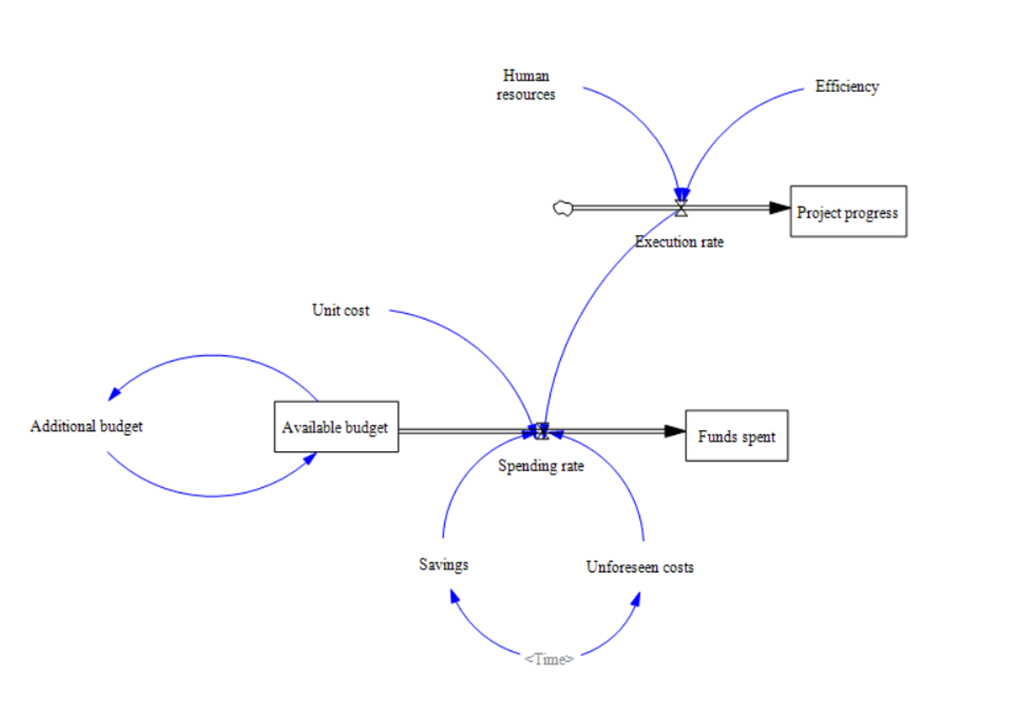
Figure 1. Spending model analysis
3 3.. Results
Simulation input values:
Human resources: 20
Unit cost: 500
Efficiency: 0.8
![]()
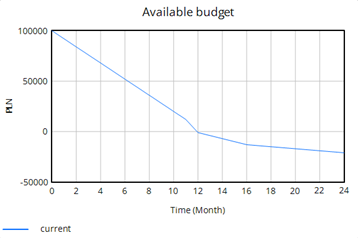
Available Budget:
Shows the current funds available. The budget is exceeded around the 12th month.
Spending Rate:
Shows the dynamics of expenditures. A steady level is maintained until month 10, then spending increases and stabilizes again around month 16.
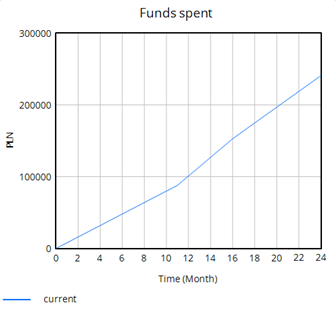
Funds Spent:
Displays the accumulated expenditures. The assumed budget (100,000 PLN) is exceeded halfway through the project.
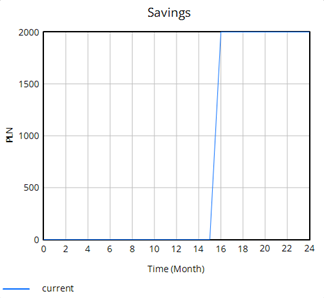
Savings:
Represents expected cost reductions appearing from month 15.
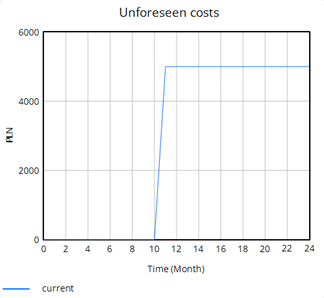
Unforeseen Costs:
Unexpected expenses emerge around month 10.
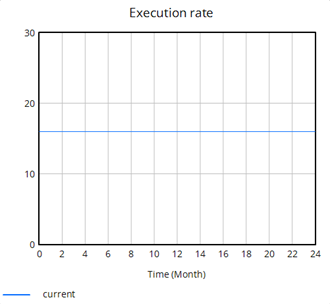
Execution Rate:
Shows a steady execution rate throughout the project duration.
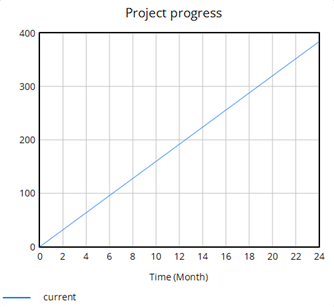
Project Progress:
Shows linear progress throughout the project, indicating consistent work over time.
4. Conclusions
The simulation illustrates how project expenditures evolve. The charts reveal that under the given assumptions, the budget is exceeded by the 12th month. This kind of simulation supports informed decisions regarding the feasibility of project completion under the assumed variable values, helping avoid potential time loss and disappointment from exceeding the budget in a real-world scenario.