Advanced Customer Acquisition Model
Stec Barbara 167533
Course: Simulation Modeling
“Advanced Customer Acquisition Model”
1. Introduction
Simulation modeling is a method used to replicate and study the behavior of complex systems over time by using mathematical representations and computational tools. It allows researchers and decision-makers to test different scenarios and understand dynamic relationships between system components without the need for real-world experimentation.
This report aims to develop a customer acquisition model using the “Vensim” software and analyze its behavior. The model is designed to simulate and understand the dynamics of processes related to acquiring new customers, such as marketing expenditures, advertising campaign effectiveness, customer recommendations, and retention.
2. Model Description
In the model, customer acquisition occurs through two main channels: recommendations from existing customers and the impact of advertising efforts. Recommendations are generated by a specific portion of current customers, in accordance with a predefined recommendation rate. The number of active customers also affects the amount of funds allocated from the general budget to marketing activities. The scale of this impact is regulated by the allocation ratio.
From the marketing fund pool, a certain percentage—defined by the advertising ratio—is allocated directly to product or service promotion. It is important to note that the market has a finite number of potential customers, meaning their number decreases over time, affecting the effectiveness of further acquisition efforts. Figure 2.1 presents the model built in “Vensim”, illustrating the described relationships and the dynamics of the customer acquisition system.
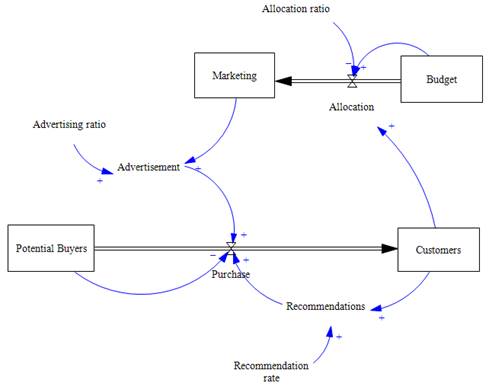
Figure 2.1 Advanced Customer Acquisition Model, source: own elaboration.
For simulation purposes, the model was initialized with the following stock variable values:
· Number of current customers (Customers): 100
· Number of potential customers (Potential Buyers): 10,000
· General budget (Budget): 1,000 units
· initial marketing funds (Marketing): 100 units
Ranges for constant values were as follows:
· Allocation ratio (budget allocation for marketing): 0.1 to 1
· Advertising ratio: 0.001 to 0.1
· Recommendation rate: 0.001 to 0.05
Defined flows:
· Allocation calculated as:
![]()
· Purchase calculated as:
![]()
Auxiliary variables:
· Advertisement calculated as:
![]()
· Recommendations calculated as:
![]()
The simulation was carried out over a time period from day 1 to day 100.
3. Simulation Results
Variant 1:
The results are shown in Figure 3.1 and Figure 3.2. With low advertising participation (low Advertising Ratio and Allocation Ratio) and a maximum Recommendation Rate, the customer acquisition process progresses fairly evenly. The budget remains largely underutilized, and the influence of recommendations and advertising on purchases is comparable. By the end of the simulation, nearly all potential customers are acquired. The Purchase variable peaks around day 75 and then declines as the number of potential customers decreases
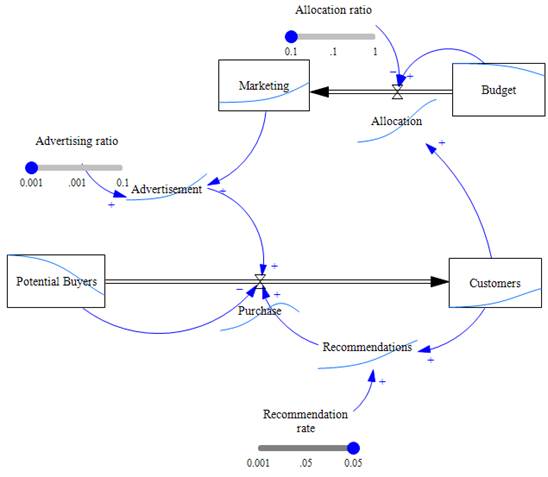
Figure 3.1 Simulation results for Variant 1, source: own elaboration.
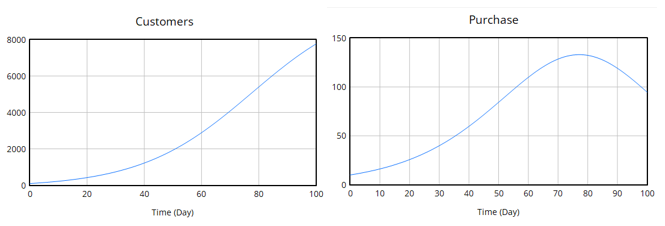
Figure 3.2. Purchase and customer number charts for Variant 1, source: own elaboration.
Variant 2:
When the Allocation Ratio is increased (while keeping a low Advertising Ratio and high Recommendation Rate), the budget is used more extensively, resulting in a faster customer growth rate. Purchase peaks around day 70 and is slightly higher than in Variant 1. The process remains relatively smooth, but clearly, higher marketing expenditures—even with low advertising efficiency—improve acquisition effectiveness. The results are presented in Figure 3.3 and Figure 3.4.
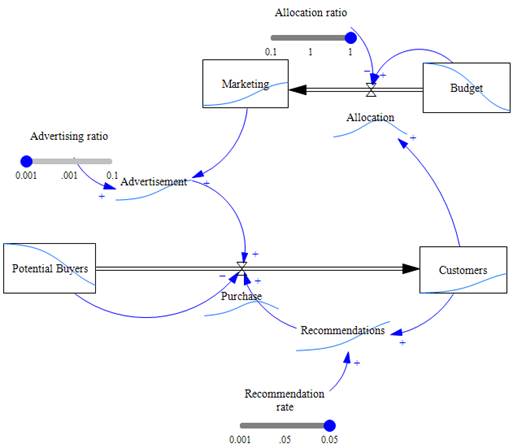
Figure 3.3 Simulation results for Variant 2, source: own elaboration.

Figure 3.4 Purchase and customer number charts for Variant 2, source: own elaboration.
Variant 3:
With maximum values for all three coefficients (Advertising Ratio, Allocation Ratio, Recommendation Rate), the system reacts very dynamically. Purchase peaks before day 10, then rapidly declines due to the quick depletion of potential customers. The number of customers reaches its maximum before day 20, and further promotional efforts become ineffective. This variant illustrates how strong reinforcing loops can quickly saturate the market. Results are shown in Figure 3. 5 and Figure 3.6.
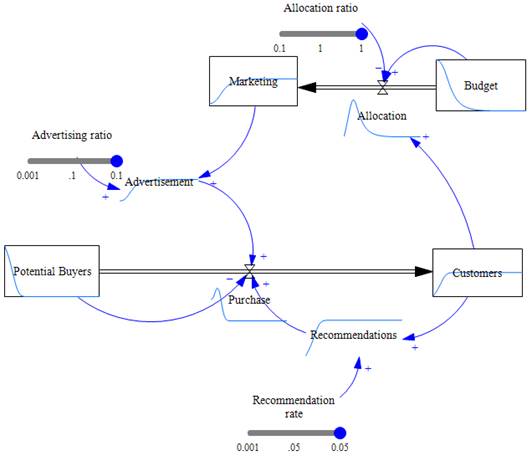
Figure 3.5 Simulation results for Variant 3, source: own elaboration.
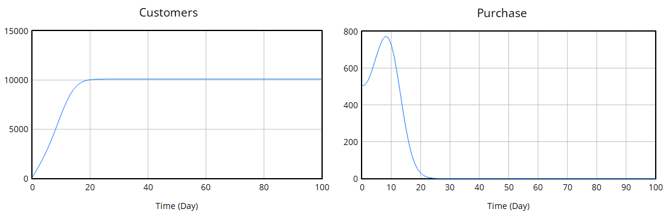
Figure 3.6 Purchase and customer number charts for Variant 3, source: own elaboration.
Variant 4:
With high Advertising Ratio and Allocation Ratio but the lowest possible Recommendation Rate, the simulation outcome is very similar to Variant 3. The difference lies in a slightly slower customer growth rate, indicating the marginal influence of recommendations when advertising is dominant. Customer acquisition remains rapid, and the market becomes saturated quickly. Results are shown in Figure 3.7 and Figure 3.8.
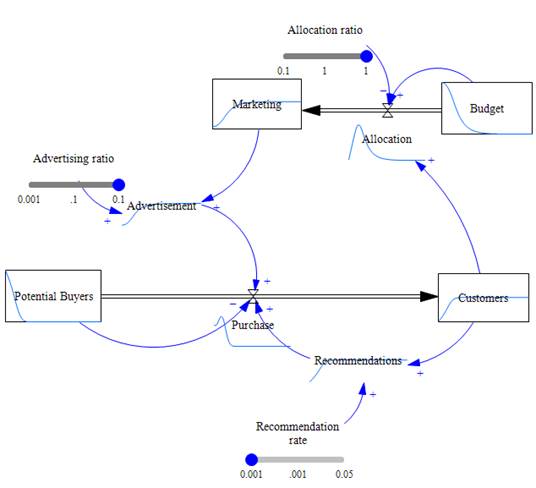
Figure 3.7 Simulation results for Variant 4, source: own elaboration.
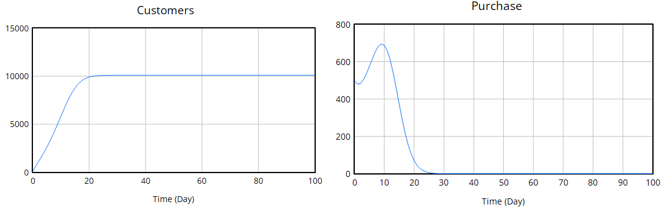
Figure 3.8 Purchase and customer number charts for Variant 4, source: own elaboration.
Variant 5:
With a high Advertising Ratio, medium Recommendation Rate, and the lowest Allocation Ratio, customer acquisition proceeds slower but more steadily. The marketing budget is gradually utilized throughout the simulation. The maximum number of customers is reached around day 40. Purchase values decrease slowly, and the acquisition process shows a balanced relationship between marketing efforts and the diminishing number of potential buyers. Results are shown in Figure 3.9 and Figure 3.10.
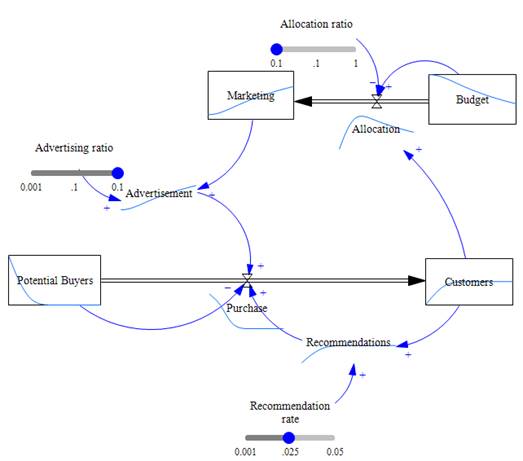
Figure 3.9 Simulation results for Variant 5, source: own elaboration..
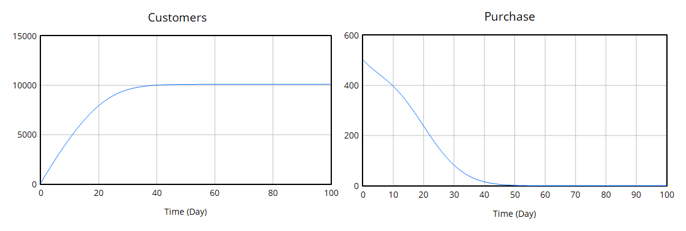
Figure 3.10 Purchase and customer number charts for Variant 5, source: own elaboration.
4. Conclusions
The simulation analysis indicates that, within the developed model, the greatest impact on the customer acquisition rate comes from advertising-related coefficients rather than recommendations. Increasing the Recommendation Rate alone does not lead to significant changes in final outcomes.
Each coefficient contributes to accelerating customer acquisition; however, their combinations determine the dynamics of the process—especially whether reinforcing or balancing loops dominate. The final number of customers and the shape of the Purchase curve depend on the balance between the intensity of marketing efforts and the progressive depletion of potential customers.